Digging deeper into the IPR situation in Africa for the Plumpy’Nut case (see Part 5 and web page), I am slowing finding facts — but it is like peeling an onion. Things may look good on paper, but the deeper layers are less and less clear. This is a subject that is actually starting to obsess me a little bit, as it seems to be a white spot on the map. No one knows, no one cares.
South Africa is a good place to start, as it is the powerhouse of the continent, and also has reasonably good statistics and information available. I will have to use fragmented and unsatisfactory data sources, and use a lot of intuition.
Intellectual property in South Africa is handled by the Companies and Intellectual Property Commission (CIPC, Web page). The CIPC page on patents does not on the face of it contain anything that would differ significantly from the European system. So far, so good.
What do the statistics say?
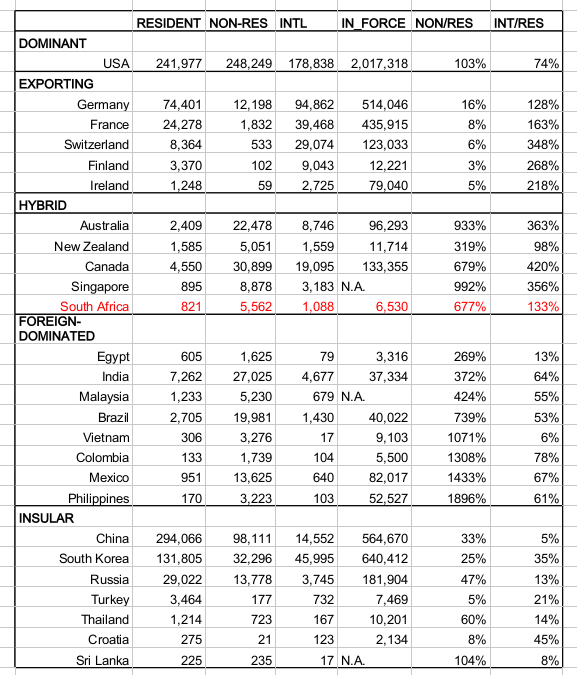
To get some inkling of how South Africa compares to other countries, WIPO statistics can be used (though with extreme care and skepticism). I chose a subset of countries, to see what kinds of classes the simple statistics would place them into. Two sources of data were used: all patent applications for 2010, and total number of patents in force in 2010. The patent applications are given in three categories: Resident (filed by a resident in the country), Non-resident (in practice filed on behalf of a foreign corporation), and International (filed by residents in other countries).
Two crucial parameters
1.The ratio of applications filed by non-residents to the applications filed by residents (NonResident/Resident ratio in the table). A high Non/Res ratio means that the country’s system is dominated by foreign patents. Very little inventing is going on on within the country, and the patent scene is dominated by foreigners.
2. The ratio of internationally filed applications to the applications filed by residents in the country (International/Resident ratio in the Table). If this ratio is much larger than 100%, it means that the country is very actively filing patents in other countries. If it is very much smaller than 100%, then the country is not really “exporting” its inventions to the world.
The USA is in a class of its own. However, otherwise the countries tend to fall quite nicely into four groups, for which I’ve invented names.
“Exporting” countries
The “exporting” countries have few foreign patents, while they are filing large amounts of international patents. (Note, however, that changing EU rules may make the Non/Res ratio a little less clear, as some countries may be bound by decisions made in other EU countries. The Non/Res ratio given here may therefore be too small in reality). These can in some sense be considered the “winner” countries, getting the benefit of international patents while not having to worry about foreign patents on their own soil. Germany and Finland are typical examples.
“Insular” countries
The “insular” countries are a very diverse bunch, but the pattern suggests that their patent system are turned in on themselves. There can be significant amounts of patenting ( China, Russia, South Korea), but overall they are somewhat outside the global patent system. Alternatively, there may be very little patenting activity whatsoever (Croatia, Sri Lanka).
“Foreign-dominated” countries
Many patents filed by non-residents, very few filed by local inventors, and very few filed by local inventors internationally. It can be argued in a national sense, they are getting all the downsides of the patent system while reaping no benefits. Foreign companies are controlling the local patent market, but there is no real local innovation activity. These are indeed all developing countries: Brazil, India, Egypt, Vietnam, Colombia, Mexico, Vietnam. (Note that there is not enough recent data on most African countries to even determine if they are in this category).
“Hybrid” countries
The “hybrid” countries do not fall into any of the other categories very well. Foreign influence is strong, but the country is also filing a lot of international applications. Given that the countries in this category are very well-to-do (the likes of Australia, Canada, and Singapore), this is probably a fairly good place to be.
Where does South Africa fit?
South Africa is borderline. It is certainly foreign-dominated, with a Non/Res ratio of more than 600%; yet with its Int/Res ratio of close to 100%, it may be reaping more benefits from the system than most of the developing countries. I would therefore hesitantly place it in the hybrid category.
On the face of it, South Africa would certainly seem to be in a better position than the rest of Africa. The important question is: is it in a significantly better position? This will be studied in the next part of the series.
More on similar issues: Dangerous patents. All Plumpy’Nut articles: here.
Acknowledgment: The research for this series has been done between 2012 and 2014. The series has benefited greatly from discussions with Kalle Pietilä, Viv Collins, Niko Porjo, and Timo Tokkonen.