“If we don’t have a number, we don’t really know anything, and we can’t learn anything more.”
Since we plan to professionally publish the Blindspin results, we can’t reveal all the things we’re theorizing about yet. But here is a look at some things we’re seeing. (More information: Blindspin project page).
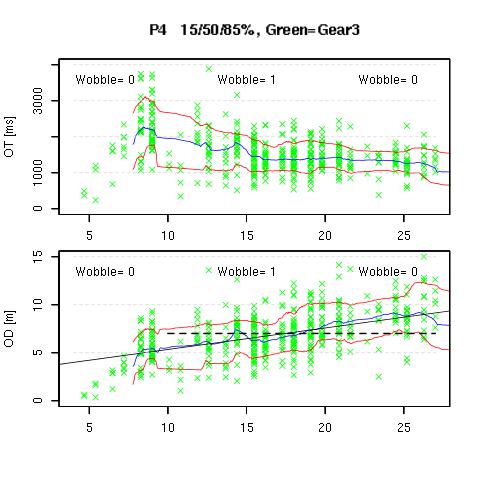
For each test subject, we’re caĺculating the occlusion time OT (time spent driving blind) and the occlusion distance OD (distance traveled during that time). They will tell us different things…. but what exactly, that will remain to be analyzed.
Below are data from one test subject, plotted as a function of speed. The bluish x’es are occlusions when driving at gear 2, the green crosses are at gear 3. The blue line show the floating median (the median of the 30 closest data points). The red lines show the 15th and 85th percentile of those data points.
The top panel shows the occlusion time, the bottom panel the occlusion distance (calculated between 10 and 22 kmh). For the occlusion distance, the least-squares linear fit is shown as a thin black line.
The thick dotted line shows that for P4, the data are also consistent with a constant occlusion distance of about 7 meters; that is, although we see a rising trend, there is enough scatter that a value of 7 meters is between the 15th and 85th percentile at all speeds.
The majority of the test subjects show a similar behavior. The occlusion time drops as a function of speed, as people (wisely) do not keep their eyes closed for long periods of time when driving faster. However, this still means that the distance traveled during the occlusion does not change very much.
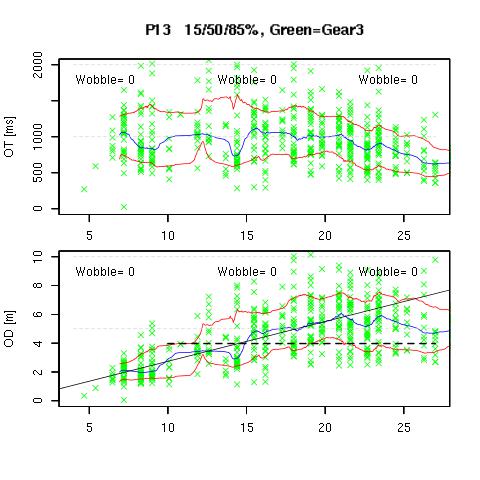
But of course human data are always messy, and there about three subjects for whom this is not the case. The OD seems to rise with speed — or to put it another way, the occlusion times are close to constant whatever the speed.

The medians for all the test subjects can be drawn on one plot. The three special cases are shown in red. One can more or less see a pattern here; for most drivers, the occlusion time drops quite consistently so that the occlusion distance stays fairly constant. However, the exact value of the occlusion distance varies from cyclist to cyclist; the values are mostly between 5 and 10 meters.

The effect is more clear if we normalize the values so that they are set to zero at maximum speed. We have the three outliers; but the others show a reasonably constant trend.

For the actual paper, we will of course have to replace weasel words like “roughly” and “mostly” with actual numbers. But we will get there.
One aspect is missing from the above plots: wobble. Some cyclists drove in a very straight line, as was the instruction; some were unable to do this very well, and wobbled. We measured this qualitatively (by observing the cyclist). We also collected gyroscope data, but are still on the process of deciphering it. If a cyclist corrects his path rapidly, it will show up in gyroscope data.
Roughly speaking, the more wobble, the more the cyclist deviated from the average median. We suspect — and may be able to suggest quantitatively — that if a cyclist drives blind for long distances, he will wobble more. Skill will affect this, but it is a fundamental phenomenon that cannot be avoided.
An obvious question is: so what? We all know that more difficult to drive for a long distance with your eyes shut, and if you do, you will wobble. All of this is common sense. We will find a few numbers, but so what?
That is actually quite typical for cognitive science or psychological studies. A huge amount of work to get a number for something that everyone knows already. But that is the whole point: if we don’t have a number, we don’t really know anything, and we can’t learn anything more.
To get systematic progress in science, we need to measure the “trivial” things first before we can measure the “important” things. That is the case for this study as well. If we ever want to get practical research done into bicycling safety, we need to do these not-particularly-practical studies first.
More information: Blindspin project page.