Analysis of the 2012 municipal elections in Finland II


I have continued my study into Python programming, see part I for earlier results. The code might not be very pythonic, despite some effort to that direction. With a little sugar coating one might say that I’m being pragmatic, a cynic might tell that I lose my bad habits slowly. At least I have tried to comment a little bit, which makes it easier for me to remember what I have been attempting to do.

In the analysis I looked into the stability of the election result. This was done by a Monte Carlo analysis. Despite the fancy name in practice I just manipulated the result by introducing random changes and then calculated what the result would have been with the new vote counts.

My motive was the eternal discussion about people not voting and how an individual has little impact on the result.

The analysis went roughly like this:

  1. Query the database for the number of votes for each candidate and sum these to get the number of votes given to each party
  2. Manipulate the result and calculate a new result
  3. Repeat 2 many times
  4. Calculate the average number of seats for each party and make a note of the largest and smallest number of councilmen
  5. Continue from 2 using a larger deviation in the manipulation.


It would have been possible to directly query the database for the elected candidates, but I wanted to do the calculation myself and compare the result for the actual confirmed result. This gave the opportunity to check how well the algorithm works. The result I calculated was not the same for all municipalities, this is because in case of same distribution figures or within a party list with the same number of votes the result is decided by a lottery. Due to the random nature of the lottery, it’s result can not be repeated in the code. Instead I allocated the seats according to the order of an internal list.

It is good to note that the my results here are in some sense suggestive only, as the effort put to confirming that the code works correctly was not at a level that would be required for example for scientific publication.

The manipulation itself was done like this:

tot=EA[k][2]*(random.uniform(-1,1)*B[m]+1)

Or put in another way:Tuusiwhere,Tuusi2

The number of votes a party accumulated in the election was multiplied by a number that was between 0.999 and 1.001 when the delta was smallest and between 0 and 2 when the delta was largest. Each time the manipulation was done a random number was drawn for each of the parties. Drawing the random number and the manipulation was done 10 000 times for each municipality to see how the result varies for each value of B. It is good to note that selection of the number of iteration was based on the “I feel like it” method that has been criticized, sometimes harshly.

The selected manipulation method doesn’t directly match with any real situation, although it is similar for example to cases where the active members of a local election team catch the plague at a critical moment or a rich benefactor enables a particularly well funded campaign. In these cases the changes in the result might be similar to what is seen in the images below. The mean number of seats gives a hint on where the number of seats gained has mostly been, close to maximum or minimum.

The clearest result can be seen in how much must the number of votes change to change the result. In the figures parameter B is shown as “delta=x” where x is the value of B used. If the minimum and maximum number of seats (red bar in the figures) gained do not differ from the average (blue in the figures) the result has been the same for all iterations, which can be interpreted as a stable result at this level of variation in the voting behaviour.

It should be noted that because the number of votes a party got in the voting is used as basis for calculations, it is not possible to get candidates elected even with large deltas if the party got for example three votes in the actual election. On the other hand even a large number of votes quickly evaporates when the value of R is very close to minus one. When the changes in the number of votes are large, it is possible that the overall number of votes given can be larger that the number of eligible voters in the municipality.

I chose five municipalities at random and looked at their result more closely: Janakkala, Kalajoki, Karkkila, Liperi and Savukoski.

I use the commonly used abbreviations for the larger parties in the text below.

In Janakkala the number of PS councilmen could have changed with a 5 % change in the number of votes they got, in absolute terms this means 54 votes. Similarly KESK could have gotten one seat more with the same relative change, corresponding to 84 votes. With a 20 % change KD could have lost their only seat.

In Savukoski if one person more would have made their way to the polling station and voted for PS the result would have been different. PS would have gotten as many councilmen as VAS. In the real elections VAS got three times as many seats as PS. Whether this would have changed any decisions is of course a different question.

Janakkala0.02Figure1. With a maximum change of 2 % the Janakkala result is unchanged.


Janakkala0.05Figure 2. With a maximum change of 5 % the number of councilmen can change. SDP and PS could lose two seats. With these changes KESK would always gain if there was a change, although most of the time it gets the same result.


Janakkala0.2Figure 3. With a maximum change of 20 % any part of the result can be different from the real one.

In figures 1 through 3 increase in parameter B starts to show as larger variation in the result. In Janakkala the result is most stable for KD and the for VIHR.

Kalajoki0.1Figure 4. In Kalajoki Pro, SDP and VIHR have fairly stable results since a 10 % change wouldn’t have an effect in their number of councilmen.


Kalajoki0.2Figure 5. It turns out the one VIHR seat is the most stable. KD would rather lose their seat than gain more.


Karkkila0.02Figure 6. In Karkkila the result would first start to change between SDP and VAS at the 2 % level, SDP would lose one seat.


Karkkila0.05Figure 7. At the 5 % level only KESK has a stable result.


Karkkila0.1Figure 8. In Karkkila the parties had fairly similar results, at the 10 % level changes can be seen in all the results.


Liperi0.01
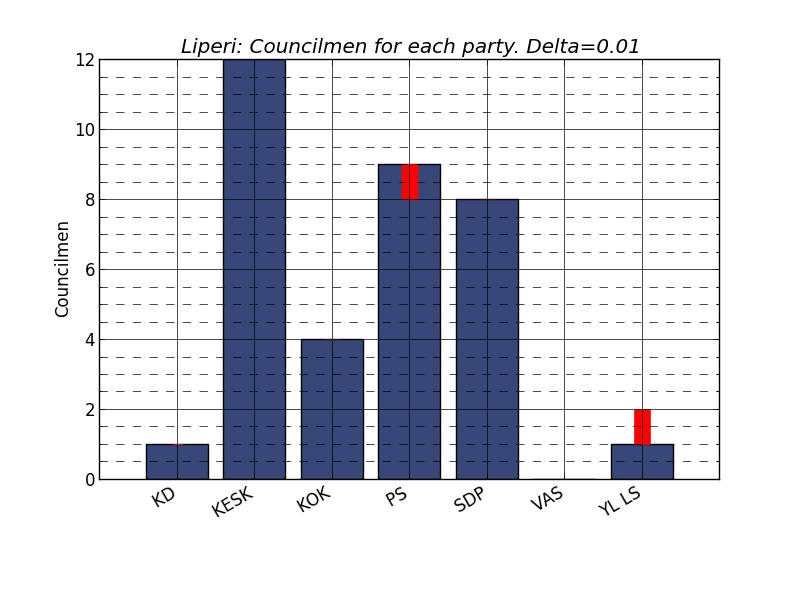
Figure 9. In Liperi the first changes can be seen between PS and YL LS at 1 % level.


Savukoski0.005Figure 10. In the Savukoski council half a percent change in the number of votes can change the result. However it would most likely not change any decisions.


Savukoski0.05Figure 11. At 5 % level KESK could lose its majority.

Table 1.JaKaKaLiSa_2

Analysis of the 2012 municipal elections in Finland I, start up


Couple of weeks ago I decided to learn Python. Mostly because I no longer have access to a Matlab license and the price of Matlab is kind of off putting. Additionally as of late I have gravitated toward free software both in the sense of no money involved and in the sense that the source code can be used as one wishes. For example Google’s cloud services and Libre Office. I have no clear answer to why Python. One reason is that someone said its fairly easy to learn if you already know Matlab.

In the vaalit.fi service it is possible to download the results of the 2012 municipal elections from this page. Descriptions for the csv-files can be found at the top of the page under instructions. Since the election are still fresh in my memory I thought I’d dig into that data as an exercise and use Python to make any tools I would need.

The file containing the results for the whole country is quite large, about 400 Mbytes. When loaded to the memory of my laptop it took about 3 Gbytes, which slowed things down dramatically. There are many ways to solve this, I decided to install a MySQL server and move the data to a database and then query whichever data I need. Although the data still would not fit to memory, it is much faster to find things when it is not necessary to go through the whole file. MySQL is also free if you don’t need to use a consultant.

It took about a week to setup everything and learn enough Python to be able to query the database I created. Although it was probably only about three days of actual work. The experience was not bad, there were some problems finding the right modules for Python, those that would enable all the calculations and drawing the figures I might want.

Infact finding the modules was not that difficult, but finding the correct ones for my operating system processor combo took some time. In the end I think I installed a version meant for AMD-processors although this laptop has an Intel one. Seems to work in any case. It was also a bit of a conundrum to select between Python 2.x and 3.x, they are not completely compatible and I couldn’t tell if the community will change to the new version or not. The modules I’d likely need were however available for 3.x so I selected that one. For me the risk should be a small one as I intend to to write scripts and not software that needs to be maintained.

I used MySQL Workbench to create the database. It was not that much work to learn the parts I needed. A small problem appeared when MySQL-connector wouldn’t work with Python version 3.3, so I had to move to 3.2. After this the biggest stumbling block was to get the connection to the database working even when it is on the same computer. Workbench seems to use something called “named pipes” but this wouldn’t work with the MySQL Python connector. After some trial I opened a hole in the firewall for the port used by MySQL and managed to find the correct initialization file where I could tell the server to listen to localhost and only it. Not quite sure what in the end made it work but the searches started to return results. Hopefully my laptop isn’t wide open now.

18 Dec 2012 is a zip file with source code and some sql for creating and quering the database. Everything in it can be freely used, modified and shared.

Below a couple of figures extracted from the data and a little bit of speculation on what can be seen. I’m too lazy to remake the figures with english texts.

Aanestysalueiden_koko_HIST200Figure 1. Size of voting areas. Size differences are quite large: there are about 20 areas with around 100 to 150 voters (eligible to vote in Finland) and a couple that are a lot larger.

The title for the largest voting area goes with 15971 voters to the aptly named area “Ä-alue 090A”, based on the municipality number it is somewhere in Helsinki.

The smallest with under a hundred voters are Markby (88), Norrby (93)  and Korsbäck (95), which are in the municipalities of Uusikaarlepyy, Kruunupyy and Korsnäs. First I thought that these areas would be in islands, but they are not. There are other small areas in these same municipalities. In Sipoo there is also an area called “saaret” (islands) which doesn’t have any eligible voters, perhaps it is not in use.

From the figure it is clear that the distribution has two peaks, but I’m not quite sure what is the reason behind this. I first thought that it was due to geography, if the distance to a polling station is too long it is going to have an effect on turnout, but in case of the smallest voting places this doesn’t seem to be the case.
Aania_aanestysalueella_HIST200Figure 2. Size of voting areas and turnout vary. For example little over 3000 votes were cast in one area. Abscissa is the number of votes given on an area, ordinate is the count of areas.

The distribution of votes in figure 2 shows the same double peak that was seen in figure 1. In ten areas the number of votes was less than 50, smallest activity (22) was seen in Aska area of Puolanka municipality, Paloniemi area in Kuhmo was clearly more active with 36 votes. Is voting secrecy adequately preserved when the number of voters is so small? At least they should shake the box before opening it.

Aanestaneiden_osuus_aanestysalueella_HIST200Figure 3. Histogram of ratio of voters to eligible voters for each voting area. If the abscissa is multiplied by 100 it gives percents.  in more detail: for each voting area the number of voters on election day was divided by the number of those eligible to vote in Finland, those who voted before the actual election day are not included.

Figure 3 shows a histogram of election day turnouts for different voting areas. In some cases the turnout was dismal. For example in Aleksanterin koulu area, city of Tampere, 78 voters showed up, the ratio of voters to eligible voters was 0.02. Perhaps this is some sort of special area?

Small areas show up on the llist of most active areas including to areas named Korsbäck. The relatively most active are however is the Ala-Ähtävä area in the Pedersöre municipality. There out of 1032 eligible voters 797 turned out on election day.


Troglodyte Driverless vehicles 5


SYSTEM AND METHOD FOR PREDICTING BEHAVIORS OF DETECTED OBJECTS

“Majority of the description text could be condensed to: autonomous vehicles should mimic the behavior of human drivers.”

The purpose of Project Troglodyte is to hunt for bad patents and to show what went wrong. For more information, please see the web page.

This patent is the fifth in a series of Google autonomous vehicle patents/applications analysed to get an understanding of the level of their inventions and the state of the autonomous car project.


Figure 1.


TIER 1: SUMMARY

It appears that the main purpose of the application is to expose a lot of prior art in one document, to make sure that it is easily found and public. This conclusion is made as there are about 12 000 words in the description but the claims only touch a very small part of it and much of the description text is obviously obvious to anyone skilled in the art, or misquoting from the application: “…understood by those of ordinary skill…“.

The actual idea that protection is sought for is changing how the vehicle is controlled based on detecting an object, classifying the object and based on the classification predicting the behavior of the object. And as Google is involved, creating a massive cloud based database of said behavioral data and sharing it around.

Majority of the description text could be condensed to: autonomous vehicles should mimic the behavior of human drivers. The description explains that processing of the object related information can be done at a location external to the car, this is also mentioned to be possible for the processing related to vehicle control decisions. This might open an interpretation that any controlling of traffic based on information originating in behavior prediction of single vehicles would fall under the protection of this patent. It would mean that any system arbitrating route decisions between vehicles to lessen traffic jams might need to license this.

Being able to predict behavior of nearby objects based on common experience is a valuable feature and will make traffic flow faster and safer. It isn’t mandatory for every autonomous vehicle though and thus wouldn’t likely block competitors from entering the field.


TIER 2: AVOIDING LICENSING

It seems that the possibility of using predictions of object behavior of nearby objects observed by other vehicles (or systems) is not mentioned. This would be useful in case large objects create shadows preventing direct observation. Using direct or network based vehicle to vehicle communication might be bandwidth limited in transferring the whole awareness of another vehicle. It would also be wasteful in use of processor resources as the same data would have to be analysed several times, so it would be prudent to  transfer only information deemed important for other vehicles.

If the classification scheme is left out it makes it possible to implement simpler threat prediction based on observed speed and direction. It would still be possible to use context dependent database to predict that for example vehicles in the left lane are more likely to transfer to the right lane during a certain time window at a certain time. This would likely be good enough for autonomous vehicles, but it would be less optimal as the classification scheme will lower the number of times the vehicle needs to alter it course to accommodate other vehicles. Vehicle without the classification ability would likely appear more selfish but if all vehicles are eventually  automated this would have less of an impact as it would now when all the drivers are humans.


TIER 3: TECHNICAL ANALYSIS

As stated above, major part of the description just portrays how humans approach driving. Context sensitive behavior prediction of classified objects is what humans are good at. But sharing the accumulated experience between humans is cumbersome. With this invention autonomous vehicles could share automatically on a massive scale. The invention here is not mind boggling, but they usually aren’t. I didn’t do a proper prior art search so it could already be out there, but generally this type of thing (essentially an optimization of a more general approach) is less likely to pop up in science fiction than most of the other stuff in the description.

The description is mostly useless. If the patent system worked, most of the stuff would have to be cut. If there is need to create prior art to stop trolls, write a white paper and publish it somewhere. For the price of a patent attorney it is probably possible to buy enough space in some regional newspaper to show the whole 12 kwords. On the other hand the description of the invention itself is very shallow in detail. Much more should have been given regarding possible ways to implement it, how to handle false identifications, how to handle different sensing abilities, who is responsible if bad data leads to accidents etc. Of course if the patent office doesn’t require this then it would be foolish for anyone to give it. Writing it down might have given a good patent engineer the chance to claim more and could have made this patent more valuable.

The claims only use a small portion of the text but cover that part fairly well. They are almost understandable, although the last one is complex enough that reading it requires more uninterrupted concentration than is usually available when the kids are around.

Troglodyte: Driverless vehicles 4


The idea is perhaps geared a bit too much around the concept of a “driver” and the thinking that she is actively following what the car does.

The purpose of Project Troglodyte is to hunt for bad patents and to show what went wrong. For more information, see the  web page.


Zone Driving

This analysis is part of a series of Google driverless car related patents and applications. This application can be found here.

When reading the analysis it might be interesting to keep in mind that Google possibly uses this idea in their test cars all the time. It would be interesting to know how much the test drives are affected by it. If driverless car development wasn’t a sideshow for Google this could even have an impact on its market value as it could conceal the technology readiness level.

Figure 1.

TIER 1: SUMMARY

This application describes a way of generating, sharing and using information about areas where the driver might want to take control of an autonomous vehicle. These areas are called zones in the text. The idea is perhaps geared a bit too much around the concept of a “driver” and the thinking that they are actively following what the car does. I for one think the exact opposite is the reason to buy an autonomous vehicle in the first place.

My real problem with this idea is the wordplay; a zone is defined as a place where the autonomous vehicle is not that autonomous or where there is a risk that it can’t cope with the environment. If a company wants to come to market before it can handle every aspect of the traffic environment it need this sort of approach. For example the vehicle avoids certain types of intersections or areas of intense pedestrian traffic where it might not be able to move as the pedestrians would be very close. One might be able to argue that a system driving solely on highways needing the driver to take control when exiting the highway is using this system if it automatically recognizes the upcoming exit and gives a warning. This in turn is pretty much a must, as highways sometimes morph to regular roads. Defining the points where control is needed as zones makes it sound like this would be something completely new.

While I don’t know how novel this idea is (I didn’t do a prior art search) it is certainly a powerful way of categorising this information. After realising what is meant by a zone the rest of the related ideas kind of flow naturally.

I would imagine that this is something the development team stumbled into as they wanted to try the car before the algorithms were able to control it in all circumstances. The difficulty of environments likely varies greatly, so it is prudent to start with the easier ones to get some experience. Come to think of it, it is possible that the first autonomous cars will be limited in their ability to navigate completely independently as they probably will be developed from cars that have some of the required features but not all, for example from cars that will be able to drive in light traffic on divided highways.

One important aspect might also be the reluctance of drivers to leave all control to the computer, this fear would likely be alleviated if there was a possibility to set parameters that trigger a notification about difficult spots. As one of the main reasons to get an autonomous car is to be able to do something else when travelling, this sort of warning/notification feature might be a must for all early models.

I noted in some of the other driverless car analysis that they are transition period ideas, that is also true in this case. The proposed feature would get most use when the roads are not built for autonomous vehicles and people are not used to the new technology. After the transition period it might get very little use as it would be required only in exceptional circumstances.


TIER 2: AVOIDING LICENSING

The zone concept could be further developed by adding some parameters such as time of day, day of week, temperature, forecasted low friction, local rush hour etc. Pop-up zones could be created if a school bus is detected or a driver indicates that one is close by, this sort of zone could expire for example in 15 minutes. The computer could automatically generate zones if it needs to use unexpected deceleration or manoeuvre violently to avoid impact.

Further there could be a voting scheme to establish and remove a zone. For example if one driver indicates a zone is needed those approaching immediately behind would get a zone warning, but if none of them takes control of their autonomous vehicle the zone would not be established.

Two obvious methods of bypassing exist, the driver follows the situation closely or the car really is autonomous. Neither is good for the business of selling autonomous cars. One possibility might be to analyze map data constantly to identify spots where the computer might need help. Roadworks are often indicated by signs which can be recognized by cameras. Some places could be indicated by a special sign which might have an RF transmitter to make them detectable beyond visible range and add some determinism. These however do not quite reach the dynamic nature of the zone idea (its best contribution I think) which could prove to be quite difficult to bypass if this application is granted in its present form.


TIER 3: TECHNICAL ANALYSIS

The word vehicle is used throughout the text, by definition it includes things such as aircraft and helicopters. Autopilots have been in use in those for some time, devices such as autothrottle seem similar to the description of taking over part of the control from the computer. Aircraft autopilots also disengage if they lose control and naturally give a warning. Almost certainly modern autopilots can be engaged for a part of the planned route and be configured to give a warning before that part ends. For example an autopilot would be used through cruise and a warning would be given when the planned descent point is reached. If the descent point is called a zone, it is at a waypoint and the waypoint information can be found on a map which is downloaded from a server the similarities a quite noticeable.

Without the zone system drivers of early autonomous vehicles may feel the need to continuously monitor the performance of the car. With it they may first set a very strict warning level and include a lot of zones and after they feel more comfortable they can let the car do more and more of the driving by itself. Because the zones are proposed to be in a map, any route can be designed so that the number of zones on the route are as few as practicable. If the driver feels tired she can select a route that is a bit longer but has less zones in it and use the time to rest.

In the description it is noted that it is not sufficient for the vehicle to be close to the zone to trigger action, the vehicle also needs to be affected the by the zone in the future. For example if the vehicle is driving on a lane that is on top of the zone on a bridge, no action is required. This is important for the functioning of the zone concept as false positives could degrade user confidence in the system. To be able to solve this problem one needs understanding of the map side of the equation: when the route is planned and then followed, the computer knows which lane it is likely going to be on when the vehicle is close to the zone. The description of this is rather sketchy and actually making a system that does this requires some knowledge of an art that is not that closely related to the zone concept.

The claims are related to the description. As mentioned above some part of the idea may have novelty issues and this of course reflects on the claims that cover that part of the description.

Troglodyte: Driverless vehicles 3

“They call it a landing strip. In my mind this is the same as having a sign over the road telling you where you are.”

The purpose of Project Troglodyte is to hunt for bad patents and to show what went wrong. For more information, see the  web page.


Transitioning a mixed-mode vehicle to autonomous mode

I recently run into this article. I browsed through the patent, here are a few comments. Note: this analysis was originally done before we developed the analysis template so the approach differs a little from the rest.

Figure 1.


TIER 1: SUMMARY

This patent seems to describe a way of reading a reference indicator (e.g. a marking in the road) and using this info to both determine the exact location of the car and to retrieve data that the indicator points to. Basically there would be a QR code in the road at some location, which is possibly a place where the vehicle stops. They call it a landing strip. In my mind this is the same as having a sign over the road telling you where you are. What about snow and ice? It is difficult to read the QR code if it is under snow. This may have been overlooked as all the inventors seem to be from California, maybe Mountain View, and according to wikipedia snow isn’t really a big problem there. But to be fair, they do indicate that using RF technologies could be used to implement the same functionality. It can, but getting the same location accuracy would be more challenging.

Is there any harm in this patent being granted? There might be if they manage to push through the idea that a computer reading road signs and taking actions based on that is now a google monopoly. It might be difficult for Google or anyone else to push through such a wide interpretation of this patent but who has the money to challenge them?

While the ideas are somewhat useful they are not that innovative. There can be several reasons for this, one is that the best parts of the application needed to be dropped during the examination (due to prior art) by the patent office but they decided to go through with it anyway. A more cynical view might be that just before the filing date someone decided that the driverless car thing might go forward and we need to patent something stat. To be complete it is worth mentioning that I may just have fallen for the trap that I have seen many times before: things are much more obvious after someone has written them down.


TIER 2: AVOIDING LICENSING

As usual the description includes a lot of stuff that is already known or otherwise obvious, for example about a page is used to describe the computer system that might be running the logic needed to use the indicators. I’m not very skilled in the art of autonomous vehicles but my feeling is that the description didn’t really include anything that the public would benefit from. This is mainly because reading a QR code or other indicator is exactly analogous to what one does when reading a sign with location information. Adding the use of an url to retrieve instructions doesn’t really make a difference in the inventiveness department. I’m left wondering what was the original idea that they invented and at what point was it removed from the patent? Also, the title and the description don’t really match. While this is nine kinds of bad when writing a school assignment it might be good for a patent (if you are the inventor) as it is more difficult for the competitors to find the information.

This patent might not be that difficult to bypass. In the short term just record the orientation and location of many road signs and use the vehicle’s approximate location from GPS or sensors to check which sign it is and then retrieve this info from a database.


TIER 3: TECHNICAL ANALYSIS

If the QR code (indicator) includes position and orientation (of the indicator) a camera can be used to get a very accurate position, “easily” with in millimeters related to the indicator. This could be useful in a few situations:

  • There is no GPS coverage
  • The GPS location accuracy is not enough to resolve the location ambiguity due to say roads being on top of each other. This can usually be deduced from the path history, but it is good to have some redundancy, if there is reboot or something.
  • On a bridge, tunnel or similar location a Lidar or radar may not have enough information as the environment is completely built or “empty”
  • The environment has been changed beyond recognition due to construction etc. I have understood that the google approach uses prior knowledge of the environment to determine the location by comparing sensor info to database. It might be that if the road has been closed for changes that the environment, not to mention road location has changed drastically. In such a case the QR code could have info on how to cross the changed part of the road until the database has been updated by the passing vehicles.

It looks like these ideas predate the lidar approach but this has been filed on May, 2011 (now is 27 July, 2012) and as long as I know google’s lidar tech using Prius is older than that. So they may have been thinking about one of the bullets above where it would be quite handy say if there is a construction in a tunnel and vehicles need to be told what to do. It is worth noting that inertial sensors can be used for fairly accurate guidance for a short while and even dead reckoning is likely good enough to avoid a couple of cones and a steamroller if it is in a designated area. Doesn’t have much to do with transitioning to autonomous mode though.

After reading the claims I have two things in my mind:

  1. I can recognize the description from the claims, which is nice and not always the case
  2. If they manage to get another patent where they define wetware to be a computer I will need to start paying licensing fees every time I drive a car.

Translate »